
Planning your career in the UAE for 2026? This is the only guide you will need. We’ve analysed the entire 52-page Michael Page 2026 Salary Guide to bring you the complete salary data, market analysis, and in-demand skills for every major industry.
Whether you are looking for a new job, negotiating a raise, or hiring top talent, the information below provides the benchmarks you need to make informed decisions.
Key Takeaways: What You Need to Know for 2026
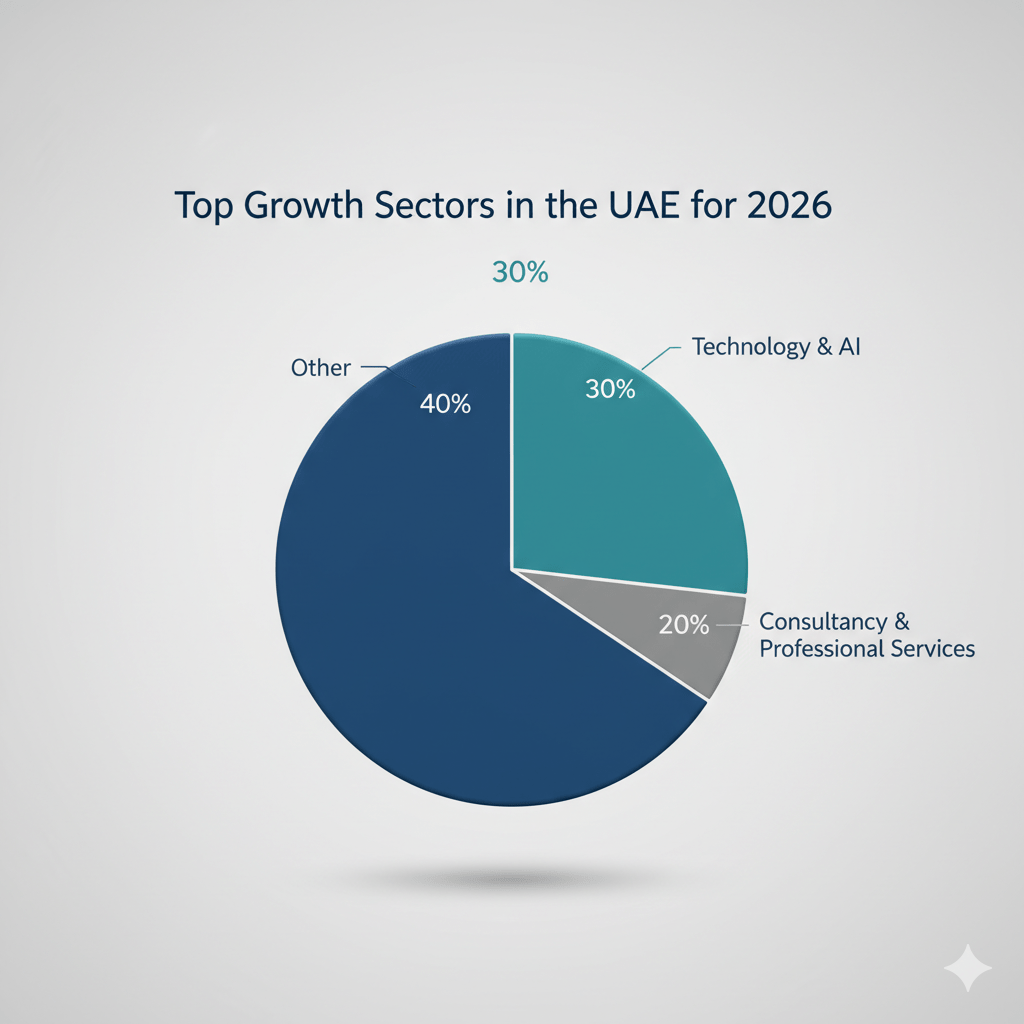
- Strong Economic Growth: The UAE’s economy is forecast to grow by 4.5%, led by finance, technology, and professional services. This creates a stable environment for job seekers.
- A Candidate’s Market: Employers report that recruiting and retaining staff is getting harder. With nearly two-thirds of professionals open to new roles, companies must offer competitive packages.
- More Than Just Money: While salary remains a top driver, work-life balance and career development are now equally important for employees.
- High-Demand Sectors: Technology (especially AI), Finance (Wealth Management & FinTech), and Consultancy (Digital & ESG) are leading the charge in hiring.
Article Index: Jump to Your Sector
- Banking and Financial Services
- Consultancy, Strategy And Change
- Data and Analytics
- Digital
- Engineering and Manufacturing
- Finance and Accounting
- Healthcare and Life Sciences
- Human Resources
- Legal and Policy (In-House)
- Legal (Private Practice)
- Procurement And Supply Chain
- Property and Construction
- Retail
- Sales and Marketing (B2B)
- Sales and Marketing (Consumer)
- Secretarial and Office Support
- Technology
- Energy
A Snapshot of the UAE Job Market
The UAE’s job market is dynamic. New business formations are up 14%, and young professionals make up over half of the workforce. This signals a vibrant economy where skilled individuals are in a strong negotiating position. Before making a move, it’s wise to understand the full picture, including the cost of living in Dubai.
Below you will find the detailed salary data for every major sector. All salaries are presented as a monthly range in thousands of UAE Dirhams (AED ‘000).
Banking and Financial Services
Driven by an influx of High-Net-Worth Individuals (HNWIs) and a FinTech boom, this sector has high demand for wealth management, compliance, and corporate banking specialists.
Wholesale Banking
| Role | From | Avg | To |
|---|---|---|---|
| Head of Wholesale Banking (EVP) | 110 | 190 | 240 |
| Head of Corporate Banking (SVP) | 100 | 120 | 140 |
| Head of Unit | 60 | 75 | 90 |
| Senior Relationship Manager | 50 | 60 | 70 |
| Relationship Manager | 37 | 45 | 50 |
| Relationship Officer / Assistant | 27 | 30 | 37 |
Retail Banking
| Role | From | Avg | To |
|---|---|---|---|
| Head of Consumer Banking (EVP) | 110 | 150 | 180 |
| Head of Retail Banking (SVP) | 95 | 100 | 132 |
| Head of Assets / Sales | 77 | 105 | 130 |
| Senior Manager Products / Sales | 45 | 55 | 65 |
| Manager Products / Sales | 30 | 40 | 50 |
| Officer / Assistant Manager | 22 | 28 | 33 |
Institutional Sales
| Role | From | Avg | To |
|---|---|---|---|
| Managing Director | 130 | 180 | 200 |
| Head of Distribution | 70 | 100 | 150 |
| Director | 70 | 90 | 110 |
| Vice President | 55 | 70 | 80 |
| Associate | 40 | 50 | 65 |
| Client Services Officer | 30 | 32 | 40 |
Investment Banking – M&A / DCM / ECM / LEV FIN
| Role | From | Avg | To |
|---|---|---|---|
| Managing Director | 100 | 150 | 180 |
| Executive / Senior Director | 75 | 95 | 130 |
| Director | 70 | 90 | 100 |
| Vice President | 60 | 75 | 90 |
| Associate | 45 | 55 | 65 |
| Analyst | 32 | 40 | 45 |
Private Equity / Investments
| Role | From | Avg | To |
|---|---|---|---|
| Managing Director / CIO | 95 | 135 | 170 |
| Senior Vice President / Senior Director | 80 | 100 | 120 |
| Vice President / Director | 65 | 80 | 90 |
| Senior Associate | 50 | 60 | 70 |
| Associate | 40 | 50 | 60 |
| Analyst | 30 | 35 | 40 |
Venture Capital / Investments
| Role | From | Avg | To |
|---|---|---|---|
| Managing Director | 90 | 110 | 140 |
| Senior Vice President / Senior Director | 70 | 85 | 100 |
| Vice President / Director | 60 | 70 | 80 |
| Senior Associate | 45 | 50 | 60 |
| Associate | 35 | 40 | 50 |
| Analyst | 25 | 30 | 35 |
Insurance
| Role | From | Avg | To |
|---|---|---|---|
| Managing Director | 80 | 115 | 155 |
| Senior Vice President / Senior Director | 65 | 75 | 95 |
| Vice President / Director | 50 | 60 | 70 |
| Senior Associate | 30 | 40 | 50 |
Compliance
| Role | From | Avg | To |
|---|---|---|---|
| Chief Compliance Officer & MLRO | 70 | 90 | 120 |
| Compliance Manager/VP & MLRO | 55 | 65 | 75 |
| Compliance Officer & MLRO | 45 | 50 | 60 |
| Compliance Associate | 25 | 30 | 35 |
| Analyst – AML/Fraud/Regulatory | 20 | 25 | 30 |
Risk
| Role | From | Avg | To |
|---|---|---|---|
| Chief Risk Officer | 85 | 105 | 180 |
| Head of Risk | 60 | 75 | 90 |
| Manager | 40 | 45 | 55 |
| Senior Analyst | 25 | 30 | 35 |
| Analyst | 22 | 25 | 30 |
Operations (Investments/Funds)
| Role | From | Avg | To |
|---|---|---|---|
| COO | 75 | 105 | 150 |
| Head of Operations | 55 | 65 | 80 |
| Operations – Middle Office | 30 | 35 | 40 |
| Operations – Back Office | 20 | 25 | 30 |
Finance & Accounting (Investments/Funds)
| Role | From | Avg | To |
|---|---|---|---|
| CFO | 85 | 130 | 200 |
| Finance Director | 60 | 80 | 100 |
| Financial Controller | 48 | 55 | 65 |
| Finance Manager | 35 | 45 | 50 |
| Senior Accountant | 22 | 25 | 30 |
| Accountant (Qualified) | 20 | 22 | 27 |
| Fund Accountant | 20 | 30 | 40 |
Consultancy, Strategy And Change
The focus is shifting from traditional strategy to execution. Professionals who can lead digital transformation and advise on ESG are highly sought after.
Internal Strategy and Transformation
| Role | From | Avg | To |
|---|---|---|---|
| Corporate Strategy & Planning | 40 | 55 | 90 |
| PMO | 35 | 48 | 75 |
| Project & Programme Management | 30 | 45 | 70 |
| Process Improvement & Business Excellence | 35 | 48 | 72 |
| Change & Transformation | 32 | 46 | 75 |
| Strategic Partnerships & Business Development | 40 | 52 | 85 |
Management Consulting and Strategy Consulting
| Role | From | Avg | To |
|---|---|---|---|
| Partner | 70 | 125 | 200 |
| Director | 60 | 90 | 135 |
| Senior Manager | 48 | 70 | 100 |
| Manager | 38 | 52 | 70 |
| Senior Consultant | 22 | 36 | 55 |
| Consultant | 16 | 28 | 42 |
| Analyst / Associate | 13 | 22 | 32 |
Data and Analytics
The market is maturing from AI experimentation to deployment. This creates huge demand for engineers and scientists who can integrate AI into business workflows.
Data Leadership & Strategy
| Role | From | Avg | To |
|---|---|---|---|
| Chief Data Officer | 80 | 100 | 120 |
| Head/Director of AI | 70 | 95 | 120 |
| Head/Director of Data Science | 70 | 80 | 90 |
| Head/Director of Data Analytics | 70 | 80 | 90 |
| Head/Director of Data Management/Engineering | 50 | 60 | 70 |
| Head/Director of Governance | 50 | 60 | 70 |
Data Foundations
| Role | From | Avg | To |
|---|---|---|---|
| Data Governance Manager | 35 | 47.5 | 60 |
| Data Architect | 35 | 47.5 | 60 |
| Master Data Management | 30 | 37.5 | 45 |
| Data Governance/Quality Specialist | 20 | 25 | 30 |
Data Engineering
| Role | From | Avg | To |
|---|---|---|---|
| Data Engineering Manager | 45 | 55 | 65 |
| AI Platform Engineer | 35 | 40 | 45 |
| Data Engineer | 30 | 35 | 40 |
| Cloud Data Engineer | 30 | 35 | 40 |
| MLOps | 30 | 37.5 | 45 |
Analytics & Insights
| Role | From | Avg | To |
|---|---|---|---|
| Data Analytics Manager | 35 | 47.5 | 60 |
| Strategic and Business Insight | 30 | 45 | 60 |
| Business Intelligence Manager | 30 | 45 | 60 |
| Data Visualisation Specialist | 20 | 27.5 | 35 |
| Data/Reporting Analyst | 20 | 27.5 | 35 |
| Analytics Business Partner | 35 | 45 | 55 |
Data Science & AI
| Role | From | Avg | To |
|---|---|---|---|
| Data Science Manager/Lead | 50 | 62.5 | 75 |
| AI Solution Architect | 35 | 42.5 | 50 |
| Applied Data Scientist (Domain Specific) | 40 | 47.5 | 55 |
| Data Scientist | 40 | 47.5 | 55 |
| Computer Vision/NLP Specialist | 30 | 37.5 | 45 |
| GenAI Engineer | 30 | 37.5 | 45 |
| AI/ML Engineer | 25 | 35 | 45 |
Product Delivery
| Role | From | Avg | To |
|---|---|---|---|
| AI Product Manager | 30 | 37 | 45 |
| Data Product Manager | 30 | 35 | 40 |
Digital
Talent that blends technical expertise with strategic impact is highly valued. A significant gap exists for senior product leaders who can bridge AI technology with customer-centric design.
Digital Marketing
| Role | From | Avg | To |
|---|---|---|---|
| Head of Digital Marketing | 40 | 50 | 60 |
| Senior Digital Marketing Manager | 30 | 40 | 50 |
| Growth Hacker | 20 | 30 | 40 |
| Digital Marketing Manager | 20 | 27.5 | 35 |
| CRM Manager | 20 | 24 | 30 |
| Social Media Manager | 15 | 22.5 | 30 |
| SEO/SEM Manager | 15 | 20 | 25 |
| Account Manager | 12 | 15 | 18 |
| Digital Marketing Executive | 12 | 15 | 18 |
User Experience and Design
| Role | From | Avg | To |
|---|---|---|---|
| UX Director | 50 | 60 | 70 |
| UX/UI Consultant/Advisor | 40 | 55 | 70 |
| Head of User Experience | 35 | 45 | 55 |
| Product Designer | 20 | 27.5 | 35 |
| UX/UI Designer | 20 | 27.5 | 35 |
| Visual/Graphic Designer | 12 | 18.5 | 25 |
Digital Transformation and Strategy
| Role | From | Avg | To |
|---|---|---|---|
| Chief Digital Officer | 60 | 90 | 120 |
| Head of Digital | 50 | 62.5 | 75 |
| Digital Transformation Manager | 40 | 52.5 | 65 |
| Agile Lead | 35 | 42.5 | 50 |
| AI Platform Delivery | 35 | 42.5 | 50 |
| Scrum Master | 30 | 35 | 40 |
| Digital Strategist | 25 | 32.5 | 40 |
| Digital Project Manager | 25 | 35 | 45 |
Product and E-commerce
| Role | From | Avg | To |
|---|---|---|---|
| Product Director | 50 | 60 | 70 |
| Head of E-Commerce/Omnichannel | 35 | 47.5 | 60 |
| Head of Product | 30 | 40 | 50 |
| AI Product Manager | 30 | 40 | 50 |
| Product Manager | 25 | 32.5 | 40 |
| E-Commerce Manager | 22 | 28.5 | 35 |
| Product Owner | 20 | 25 | 30 |
| E-Commerce Specialist | 18 | 20 | 22 |
Development
| Role | From | Avg | To |
|---|---|---|---|
| CTO | 60 | 75 | 90 |
| Head of Development | 45 | 50 | 55 |
| Software Development Manager | 35 | 40 | 45 |
| Blockchain Developer | 30 | 40 | 50 |
| Senior DevOps Engineer | 30 | 40 | 50 |
| Senior QA Analyst | 30 | 35 | 40 |
| Lead Developer | 25 | 30 | 35 |
| Senior Back End Developer | 25 | 32.5 | 40 |
| Senior Front End Developer | 22 | 30 | 38 |
| Full Stack Developer | 20 | 22.5 | 25 |
| DevOps Engineer | 20 | 25 | 30 |
| Test Automation Engineer | 20 | 27.5 | 35 |
| Back End Developer | 18 | 22.5 | 27 |
| Front End Developer | 18 | 21.5 | 25 |
| Mobile Native Developer | 18 | 21.5 | 25 |
Engineering and Manufacturing
Automation and digital tools are transforming this sector, creating high demand for professionals who combine core engineering expertise with strong digital skills.
Management
| Role | From | Avg | To |
|---|---|---|---|
| VP | 70 | 120 | 140 |
| CEO | 90 | 140 | 170 |
| COO | 70 | 100 | 115 |
| Managing Director | 75 | 100 | 115 |
| General Manager | 55 | 85 | 100 |
| Global Manufacturing Director | 60 | 80 | 95 |
| Business Excellence Director | 50 | 60 | 75 |
| Business Excellence Manager | 40 | 50 | 60 |
| Operations Director | 60 | 70 | 85 |
| Manufacturing Director | 50 | 62 | 75 |
| Factory / Plant Manager | 40 | 50 | 60 |
| Production Manager | 25 | 30 | 40 |
| Production Supervisor | 15 | 20 | 25 |
| Production Engineer | 9 | 11 | 14 |
Quality, Sustainability and Maintenance
| Role | From | Avg | To |
|---|---|---|---|
| Quality Director (QA / QC) | 45 | 55 | 65 |
| Quality Manager (QA / QC) | 30 | 35 | 45 |
| Quality Engineer (QA / QC) | 10 | 15 | 17 |
| Sustainability Manager | 35 | 40 | 50 |
| Maintenance Manager | 30 | 36 | 40 |
| Maintenance Supervisor | 13 | 17 | 21 |
| Maintenance Engineer | 10 | 12 | 15 |
| HSE Director | 40 | 50 | 65 |
| HSE Manager | 30 | 35 | 45 |
| HSE Supervisor/Coordinator | 13 | 17 | 23 |
| HSE Engineer / Officer | 9 | 13 | 17 |
Research and Regulation
| Role | From | Avg | To |
|---|---|---|---|
| R&D / NPD Director | 50 | 65 | 80 |
| R&D / NPD Manager | 30 | 35 | 40 |
| Senior R&D / NPD Technologist | 16 | 20 | 25 |
| R&D / NPD Technologist | 10 | 12 | 17 |
| Lab Manager | 30 | 34 | 40 |
| Regulatory Affairs Director | 50 | 55 | 70 |
| Regulatory Affairs Manager / Associate | 22 | 30 | 35 |
| Regulatory Affairs Engineer | 12 | 15 | 18 |
| Continuous Improvement Manager | 30 | 35 | 40 |
| Continuous Improvement Engineer | 12 | 15 | 18 |
Project
| Role | From | Avg | To |
|---|---|---|---|
| Project Director | 45 | 60 | 90 |
| Project Manager | 35 | 40 | 45 |
| Project Engineer | 10 | 18 | 25 |
| Design Manager | 15 | 20 | 30 |
Finance and Accounting
Demand is high for candidates with experience in AI, digital transformation, and automation. The establishment of finance shared service centres is also a major trend.
Senior Finance
| Role | From | Avg | To |
|---|---|---|---|
| Group / Regional CFO – SME | 70 | 90 | 120 |
| Group / Regional CFO – MNC | 110 | 150 | 200 |
| CFO – SME | 60 | 75 | 90 |
| CFO – MNC | 80 | 100 | 120 |
| FP&A Director – SME | 50 | 60 | 65 |
| FP&A Director – MNC | 60 | 65 | 75 |
| Finance Director – SME | 60 | 65 | 75 |
| Finance Director – MNC | 65 | 70 | 80 |
| Financial Controller – SME | 35 | 40 | 45 |
| Financial Controller – MNC | 45 | 50 | 55 |
| Finance Manager – SME | 25 | 30 | 35 |
| Finance Manager – MNC | 35 | 40 | 45 |
| FP&A Manager – SME | 30 | 35 | 40 |
| FP&A Manager – MNC | 37 | 42 | 48 |
Controlling Roles
| Role | From | Avg | To |
|---|---|---|---|
| Senior FP&A Analyst – SME | 23 | 26 | 28 |
| Senior FP&A Analyst – MNC | 25 | 28 | 32 |
| Finance Analyst / Associate – SME | 18 | 22 | 25 |
| Finance Analyst / Associate – MNC | 23 | 25 | 28 |
| Credit Manager – SME | 28 | 32 | 36 |
| Credit Manager – MNC | 35 | 42 | 47 |
| Financial / Management Accountant – SME | 18 | 22 | 25 |
| Financial / Management Accountant – MNC | 22 | 25 | 28 |
| Business Controller / Finance Business Partner – SME | 30 | 32 | 37 |
| Business Controller / Finance Business Partner – MNC | 40 | 43 | 45 |
| Credit Controller – SME | 20 | 23 | 25 |
| Credit Controller – MNC | 25 | 30 | 35 |
Accounting Roles
| Role | From | Avg | To |
|---|---|---|---|
| General Ledger Accountant – SME | 13 | 15 | 18 |
| General Ledger Accountant – MNC | 15 | 18 | 20 |
| Junior Accountant (General) – SME | 10 | 13 | 15 |
| Junior Accountant (General) – MNC | 14 | 17 | 18 |
| AR / AP Manager – SME | 20 | 22 | 25 |
| AR / AP Manager – MNC | 25 | 28 | 32 |
| AR / AP Accountant – SME | 12 | 14 | 16 |
| AR / AP Accountant – MNC | 14 | 16 | 18 |
| Assistant Accountant – SME | 8 | 10 | 12 |
| Assistant Accountant – MNC | 10 | 14 | 16 |
| Payroll Manager – SME | 18 | 20 | 22 |
| Payroll Manager – MNC | 20 | 23 | 26 |
Audit
| Role | From | Avg | To |
|---|---|---|---|
| Chief Audit Officer – SME | 55 | 65 | 70 |
| Chief Audit Officer – MNC | 70 | 100 | 140 |
| Head of Internal Audit – SME | 40 | 55 | 60 |
| Head of Internal Audit – MNC | 60 | 75 | 85 |
| Audit Manager – SME | 30 | 35 | 40 |
| Audit Manager – MNC | 35 | 40 | 45 |
| Senior (Internal) Auditors – SME | 18 | 21.5 | 25 |
| Senior (Internal) Auditors – MNC | 20 | 25 | 30 |
| (Internal) Auditors – SME | 16 | 18 | 22 |
| (Internal) Auditors – MNC | 18 | 23 | 27 |
Treasury
| Role | From | Avg | To |
|---|---|---|---|
| Treasurer – SME | 65 | 70 | 80 |
| Treasurer – MNC | 80 | 105 | 130 |
| Head of Treasury – SME | 50 | 60 | 70 |
| Head of Treasury – MNC | 70 | 80 | 90 |
| Treasury Manager – SME | 35 | 40 | 45 |
| Treasury Manager – MNC | 45 | 50 | 55 |
| Treasury Analyst – SME | 20 | 23 | 26 |
| Treasury Analyst – MNC | 25 | 27.5 | 30 |
Tax
| Role | From | Avg | To |
|---|---|---|---|
| Tax Director – SME | 60 | 70 | 80 |
| Tax Director – MNC | 80 | 95 | 115 |
| Tax Manager – SME | 40 | 45 | 50 |
| Tax Manager – MNC | 45 | 50 | 55 |
| Senior Tax Analyst / Associate – (Direct Tax) – SME | 22 | 28 | 31 |
| Senior Tax Analyst / Associate – (Direct Tax) – MNC | 28 | 32 | 36 |
| Indirect Tax / VAT Manager – SME | 25 | 30 | 35 |
| Indirect Tax / VAT Manager – MNC | 30 | 38 | 45 |
| Indirect Tax / VAT Accountant – SME | 18 | 20 | 22 |
| Indirect Tax / VAT Accountant – MNC | 18 | 23 | 26 |
Healthcare and Life Sciences
Digital health, telemedicine, and AI-driven solutions are creating demand for professionals skilled in health informatics and data analytics. Local pharmaceutical manufacturing is also a key growth driver.
Sales
| Role | From | Avg | To |
|---|---|---|---|
| General Manager / VP / C-suite | 60 | 85 | 110 |
| Regional Sales Director | 40 | 60 | 80 |
| Regional Sales Manager | 30 | 37.5 | 45 |
| Clinical Application Specialist | 20 | 27.5 | 35 |
| Sales Representative | 12 | 16 | 20 |
Marketing
| Role | From | Avg | To |
|---|---|---|---|
| Chief Marketing Officer | 60 | 85 | 110 |
| Marketing Director | 50 | 65 | 80 |
| Regional Marketing Manager | 30 | 40 | 50 |
| Regional Marketing Specialist | 15 | 20 | 25 |
| Product Specialist | 15 | 18 | 25 |
Regulatory Affairs
| Role | From | Avg | To |
|---|---|---|---|
| Regulatory Affairs Director | 50 | 60 | 70 |
| Regulatory Affairs Manager | 30 | 40 | 50 |
| Regulatory Affairs Associate | 20 | 23.5 | 27 |
Medical Science
| Role | From | Avg | To |
|---|---|---|---|
| Medical Director | 50 | 60 | 80 |
| Medical Manager | 35 | 47.5 | 60 |
| Medical Science Liaison (MSL) | 30 | 35 | 40 |
Healthcare (Hospitals / Laboratories / Clinics)
| Role | From | Avg | To |
|---|---|---|---|
| Chief Executive Officer | 80 | 115 | 150 |
| Chief Medical Officer | 70 | 90 | 120 |
| Chief Operation Officer | 80 | 90 | 120 |
| Chief Nursing Officer | 70 | 95 | 120 |
| Doctor / Physician (Consultant) | 40 | 70 | 100 |
| Doctor / Physician (Specialist) | 25 | 42.5 | 60 |
| Laboratory / Quality Director | 40 | 55 | 70 |
| Laboratory / Quality Manager | 30 | 35 | 40 |
| Clinical Research Associate | 20 | 27.5 | 35 |
| Revenue Cycle Management (RCM) | 30 | 50 | 70 |
| Patient Experience | 25 | 35 | 40 |
Human Resources
HR is shifting from a support function to a strategic driver of retention and performance. HR analytics and Organisational Design are key growth areas.
Generalist
| Role | From | Avg | To |
|---|---|---|---|
| VP HR / CHRO | 80 | 85 | 110 |
| HR Director | 70 | 80 | 90 |
| Head of HR | 50 | 60 | 70 |
| Regional HR Manager / HR Business Partner | 35 | 45 | 55 |
| HR Manager | 25 | 38 | 45 |
| HR Coordinator / Specialist | 18 | 25 | 30 |
Recruitment / Talent Acquisition
| Role | From | Avg | To |
|---|---|---|---|
| Head of Talent Acquisition / Director | 50 | 65 | 80 |
| Talent Acquisition Manager | 30 | 40 | 50 |
| Talent Acquisition Specialist | 20 | 25 | 30 |
Learning & Development / Training
| Role | From | Avg | To |
|---|---|---|---|
| Head of Learning Development / Director | 60 | 60 | 80 |
| Learning & Development / Training Manager | 40 | 45 | 55 |
| Learning & Development / Training Officer | 20 | 25 | 30 |
Talent Management
| Role | From | Avg | To |
|---|---|---|---|
| TM Director | 60 | 70 | 80 |
| TM Manager | 45 | 50 | 55 |
| TM Specialist | 30 | 35 | 40 |
Reward
| Role | From | Avg | To |
|---|---|---|---|
| Head of Reward/C&B | 60 | 70 | 80 |
| Compensation & Benefits Manager | 35 | 45 | 55 |
| Compensation & Benefits Officer / Analyst | 20 | 30 | 35 |
Organisational Design/Development
| Role | From | Avg | To |
|---|---|---|---|
| OD Director | 60 | 70 | 80 |
| OD Manager | 45 | 50 | 55 |
| OD Specialist/Officer | 30 | 35 | 40 |
Legal and Policy (In-House)
The market demands specialists over generalists, especially in financial services, energy, and digital regulation. Mid-level counsels (3-5 years) saw a massive 15% salary increase.
In-House
| Role | From | Avg | To |
|---|---|---|---|
| General Counsel / Chief Legal Officer | 85 | 120 | 175 |
| Head of Legal / Legal Director | 65 | 90 | 120 |
| Senior Legal Counsel | 40 | 48 | 58 |
| Legal Counsel | 32 | 40 | 50 |
| Paralegal | 22 | 30 | 35 |
Policy
| Role | From | Avg | To |
|---|---|---|---|
| Public Affairs/Regulatory Affairs Manager | 65 | 80 | 90 |
| Policy Head | 45 | 60 | 80 |
| Policy Expert/Advisor | 40 | 50 | 70 |
| Policy Manager | 30 | 35 | 45 |
| Policy Specialist | 25 | 30 | 35 |
Compliance
| Role | From | Avg | To |
|---|---|---|---|
| Chief Compliance Officer | 75 | 90 | 130 |
| Compliance Director | 50 | 65 | 80 |
| Compliance Manager | 38 | 45 | 55 |
| Compliance Specialist | 22 | 30 | 35 |
Legal (Private Practice)
Competition for top talent is fierce, with core recruitment areas in Projects, Corporate (M&A, PE), and Litigation.
Generalist
| Role | From | Avg | To |
|---|---|---|---|
| Partner | 90 | 130 | 200 |
| Counsel | 75 | 85 | 110 |
| Senior Associate | 52 | 65 | 95 |
| Associate | 37 | 48 | 85 |
| Newly Qualified | 30 | 40 | 60 |
| Paralegal | 22 | 30 | 45 |
| Legal Secretary | 18 | 22.5 | 27 |
Procurement And Supply Chain
Driven by digital transformation and sustainability, companies need professionals who can lead ESG-aligned sourcing and implement AI-driven procurement systems.
Procurement
| Role | From | Avg | To |
|---|---|---|---|
| Chief Procurement Officer | 100 | 125 | 150 |
| VP / Executive Director of Procurement | 80 | 100 | 120 |
| Procurement Director | 70 | 85 | 100 |
| Procurement Manager | 40 | 50 | 60 |
| Category Manager | 30 | 35 | 45 |
| Buyer / Procurement Specialist | 15 | 25 | 30 |
| Assistant Buyer | 12 | 15 | 20 |
Supply Chain
| Role | From | Avg | To |
|---|---|---|---|
| Chief Supply Chain Officer | 100 | 125 | 150 |
| VP of Supply Chain | 80 | 100 | 130 |
| Supply Chain / Logistics Director | 65 | 70 | 90 |
| Supply Chain Manager | 35 | 45 | 55 |
| Operations Manager | 30 | 35 | 50 |
| Demand Planning Manager | 30 | 40 | 50 |
| Customer Service Manager | 24 | 28 | 35 |
| Supply Planning Manager | 30 | 40 | 50 |
| Logistics Manager | 28 | 30 | 40 |
| Fleet / Transportation Manager | 20 | 25 | 35 |
| Warehouse Manager | 20 | 25 | 35 |
| Warehouse Supervisor | 18 | 20 | 25 |
| Demand / Supply / Inventory Planner | 18 | 25 | 30 |
| Supply Chain Coordinator | 14 | 18 | 20 |
| Logistics Executive / Coordinator / Specialist | 12 | 15 | 20 |
Property and Construction
The UAE real estate market continues to set records. There is persistent demand for development, design, and project management professionals with full lifecycle delivery experience.
Master Developers
| Role | From | Avg | To |
|---|---|---|---|
| Chief Development Officer | 100 | 150 | 200 |
| Chief Projects / Delivery Officer | 100 | 140 | 180 |
| Development Director | 65 | 80 | 100 |
| Development Senior Manager | 40 | 50 | 60 |
| Development Manager | 30 | 40 | 50 |
| Design Director | 50 | 65 | 80 |
| Design Manager | 35 | 40 | 45 |
| Project Director | 60 | 75 | 90 |
| Project Manager | 35 | 42 | 50 |
| Facilities Director | 55 | 70 | 85 |
| Asset Management Director | 50 | 70 | 90 |
| Facilities Manager | 30 | 40 | 50 |
| Leasing Manager | 20 | 35 | 50 |
| Infrastructure Director | 60 | 75 | 90 |
| Infrastructure Manager | 35 | 45 | 55 |
| Planning Director | 60 | 75 | 90 |
| Project Controls Director | 50 | 65 | 80 |
| MEP Director | 45 | 60 | 75 |
| Senior QA/QC Manager | 45 | 55 | 65 |
| QA/QC Manager | 35 | 40 | 45 |
Real Estate Sales & Marketing – Master Developers
| Role | From | Avg | To |
|---|---|---|---|
| Chief Commercial Officer/ Chief Sales Officer | 80 | 100 | 120 |
| Sales Director | 45 | 65 | 85 |
| Sales Manager | 20 | 25 | 30 |
| Marketing Director | 55 | 70 | 85 |
| Marketing Manager | 25 | 35 | 45 |
PMC/Engineering Consultancy
| Role | From | Avg | To |
|---|---|---|---|
| Project Delivery / Design / Commercial – Director | 65 | 80 | 95 |
| Project Delivery/ Design / Commercial – Manager | 35 | 50 | 65 |
| Engineer | 15 | 22 | 30 |
| Architect | 15 | 20 | 25 |
| Urban Planner | 30 | 37 | 45 |
Retail
While luxury fashion demand is muted, the beauty sector is a standout performer. Brands need to localize effectively, investing in digital capabilities and consumer insights.
Retail Operations
| Role | From | Avg | To |
|---|---|---|---|
| CEO | 90 | 120 | 180 |
| Managing Director / General Manager | 70 | 80 | 120 |
| Sales Director | 35 | 50 | 65 |
| Retail Director | 30 | 45 | 60 |
| Sales Manager | 20 | 30 | 35 |
| Operations Manager | 25 | 40 | 50 |
| Retail / Area Manager | 30 | 35 | 45 |
| Training Manager | 25 | 30 | 40 |
| Trainer | 15 | 20 | 30 |
| Wholesale Manager | 25 | 30 | 35 |
| Key Account Manager | 20 | 25 | 30 |
| Store Director – Luxury | 40 | 50 | 60 |
| Store Director – Value to Mid-Range | 20 | 30 | 40 |
| Store Manager – Luxury | 25 | 35 | 45 |
| Store Manager – Value to Mid-Range | 15 | 25 | 30 |
| Sales Associate – Luxury | 12 | 15 | 20 |
| Sales Associate – Value to Mid-Range | 7 | 11 | 15 |
Marketing & Communications
| Role | From | Avg | To |
|---|---|---|---|
| Marketing Director | 40 | 55 | 70 |
| Marketing Manager | 30 | 40 | 45 |
| PR Manager | 25 | 35 | 40 |
| Trade Marketing Manager | 20 | 25 | 35 |
| PR Executive | 15 | 20 | 25 |
| Marketing Executive | 15 | 20 | 25 |
Buying & Merchandising / Planning
| Role | From | Avg | To |
|---|---|---|---|
| Merchandise / Buying Director | 50 | 65 | 70 |
| Head of Merchandising / Buying | 40 | 50 | 60 |
| Merchandise Manager / Buying Manger | 25 | 35 | 40 |
| Senior Merchandiser / Buyer | 20 | 25 | 30 |
| Merchandiser / Buyer | 15 | 20 | 25 |
Visual Merchandising
| Role | From | Avg | To |
|---|---|---|---|
| Head of Visual Merchandising | 35 | 45 | 50 |
| Visual Merchandise Manager – Regional | 20 | 30 | 40 |
| Visual Merchandise Manager – Local | 20 | 30 | 35 |
| In store Visual Merchandiser | 12 | 15 | 20 |
Design
| Role | From | Avg | To |
|---|---|---|---|
| Head of Design | 25 | 30 | 40 |
| Fashion Designer | 20 | 25 | 30 |
| Designer | 15 | 20 | 30 |
Sales and Marketing (B2B)
Strong hiring momentum continues, driven by investment in construction, energy, technology, and logistics. The UAE’s investment in AI is attracting many tech vendors to hire sales staff locally.
Sales
| Role | From | Avg | To |
|---|---|---|---|
| CEO | 100 | 120 | 160 |
| CCO/ Vice President | 75 | 90 | 135 |
| Regional Sales Director | 55 | 70 | 85 |
| Regional Sales Manager | 35 | 40 | 60 |
| Business Development Manager | 25 | 35 | 50 |
| Country Sales Manager | 35 | 45 | 60 |
| Project Sales Manager | 20 | 30 | 40 |
| Key Account Manager/Area Sales Manager | 20 | 30 | 45 |
| Sales Engineer | 15 | 25 | 30 |
| Business Development Executive | 10 | 15 | 20 |
Marketing
| Role | From | Avg | To |
|---|---|---|---|
| CMO | 80 | 100 | 130 |
| Head of Marketing/Marketing Director | 55 | 70 | 100 |
| Regional PR/Comms Director | 40 | 60 | 80 |
| PR/Comms Manager | 30 | 45 | 65 |
| Regional Head of Product | 40 | 60 | 75 |
| Bid Director | 40 | 50 | 65 |
| Bid Manager | 25 | 35 | 50 |
| Manager – Sales Analytics | 20 | 30 | 40 |
| Marketing Research | 12 | 24 | 30 |
Sales and Marketing (Consumer)
More international brands are basing senior leaders in the UAE, making it a true decision-making hub. Businesses are looking for leaders who can use analytics and customer insights to drive growth.
Sales
| Role | From | Avg | To |
|---|---|---|---|
| CEO (commercial) | 110 | 150 | 180 |
| Vice President | 80 | 100 | 120 |
| General Manager | 60 | 80 | 120 |
| Sales / Commercial Director | 60 | 80 | 100 |
| Country Manager | 40 | 50 | 60 |
| Regional Sales Manager / GCC Sales Manager | 30 | 45 | 55 |
| Key Account Manager / National Account Manager | 20 | 25 | 35 |
| Key Account Executive | 10 | 15 | 20 |
Marketing
| Role | From | Avg | To |
|---|---|---|---|
| Chief Marketing Officer | 80 | 90 | 120 |
| Head of Marketing / Marketing Director | 60 | 70 | 80 |
| Marketing Manager / Group Product Manager | 45 | 50 | 60 |
| Senior Brand Manager | 35 | 40 | 45 |
| Brand Manager | 25 | 30 | 35 |
| Assistant Brand Manager / Marketing Executive | 15 | 20 | 25 |
Trade Marketing
| Role | From | Avg | To |
|---|---|---|---|
| Head of Trade Marketing | 40 | 55 | 65 |
| Trade Marketing Manager (Regional Role) | 25 | 33 | 45 |
| Trade Marketing Manager (Country Specific) | 20 | 25 | 30 |
| Trade Marketing Executive | 13 | 15 | 20 |
Consumer Insights
| Role | From | Avg | To |
|---|---|---|---|
| Consumer Insights Director | 40 | 50 | 60 |
| Consumer Insights Manager | 20 | 30 | 40 |
| Consumer Insights Executive | 15 | 17 | 20 |
Secretarial and Office Support
A surge in new company setups is driving high demand for experienced Office Managers and Executive Assistants, particularly those with experience in start-up environments.
Financial Services and Management Consultancies
| Role | From | Avg | To |
|---|---|---|---|
| Receptionist | 12 | 15 | 18 |
| General Administration | 12 | 15 | 18 |
| Personal Assistant | 22 | 26 | 30 |
| Team Assistant | 15 | 18 | 24 |
| Executive Assistant | 25 | 30 | 40 |
| Office Manager | 25 | 35 | 45 |
Government/Semi Government
| Role | From | Avg | To |
|---|---|---|---|
| Receptionist | 10 | 14 | 16 |
| General Administration | 12 | 15 | 18 |
| Senior Administration | 18 | 22 | 25 |
| Legal Secretary | 20 | 25 | 30 |
| Team Assistant | 17 | 22 | 25 |
| Executive Assistant | 18 | 28 | 40 |
| Office Manager | 22 | 30 | 40 |
SME
| Role | From | Avg | To |
|---|---|---|---|
| Receptionist | 8 | 10 | 15 |
| General Administration | 8 | 10 | 15 |
| Personal Assistant | 15 | 18 | 22 |
| Executive Assistant | 15 | 18 | 22 |
| Office Manager | 18 | 20 | 25 |
MNC
| Role | From | Avg | To |
|---|---|---|---|
| Receptionist | 10 | 15 | 20 |
| General Administration | 12 | 15 | 18 |
| Office Manager | 25 | 30 | 35 |
MNC Legal Firms
| Role | From | Avg | To |
|---|---|---|---|
| Receptionist | 11 | 15 | 17 |
| Legal Secretary | 22 | 28 | 30 |
| Office Manager | 25 | 35 | 40 |
Technology
Leadership hiring (CIO, VP, Head of Tech) has become more prominent as companies focus on governance and long-term transformation. Cybersecurity and Cloud skills remain critical.
Executive / Leadership
| Role | From | Avg | To |
|---|---|---|---|
| Chief Information Officer (CIO) | 70 | 110 | 150 |
| Chief Technology Officer (CTO) | 60 | 100 | 140 |
| Chief Information Security Officer (CISO) | 60 | 90 | 120 |
| IT Director | 50 | 70 | 90 |
| Head of IT | 40 | 55 | 70 |
| IT Manager | 20 | 30 | 40 |
Enterprise Applications
| Role | From | Avg | To |
|---|---|---|---|
| Head of Applications | 50 | 65 | 80 |
| Business Applications Manager | 30 | 40 | 50 |
| Technical / Functional Consultant | 25 | 32.5 | 40 |
| ERP Project Manager | 30 | 42.5 | 55 |
| ERP Consultant | 25 | 30 | 35 |
| ERP Business Analyst | 20 | 25 | 30 |
| ERP Support Analyst | 10 | 14 | 18 |
Business Analysis & Project Management
| Role | From | Avg | To |
|---|---|---|---|
| PMO Leadership (Head/Manager) | 35 | 52.5 | 70 |
| IT Business Partner | 35 | 45 | 55 |
| Programme Manager | 40 | 60 | 80 |
| Project Manager | 25 | 42.5 | 60 |
| Change Manager | 35 | 40 | 45 |
| Senior Business Analyst | 25 | 35 | 45 |
| Business Analyst | 20 | 27.5 | 35 |
Infrastructure
| Role | From | Avg | To |
|---|---|---|---|
| Infrastructure Head / Director | 40 | 55 | 70 |
| Infrastructure Manager | 25 | 37.5 | 50 |
| Infrastructure Engineer | 15 | 17.5 | 20 |
| Systems Administrator | 15 | 20 | 25 |
| Network Engineer | 15 | 20 | 25 |
| Infrastructure Specialist | 20 | 25 | 30 |
| Service Delivery Manager | 32 | 38.5 | 45 |
| Database Administrator | 20 | 25 | 30 |
Technical Services
| Role | From | Avg | To |
|---|---|---|---|
| Technical Support Manager | 20 | 30 | 40 |
| IT Support Engineer | 10 | 15 | 20 |
| Application Support Analyst | 13 | 17.5 | 22 |
Cloud, DevOps, & Architecture
| Role | From | Avg | To |
|---|---|---|---|
| Head of Enterprise Architecture | 50 | 65 | 80 |
| DevOps Lead | 45 | 57.5 | 70 |
| DevOps Engineer | 20 | 30 | 40 |
| Solutions Architect | 30 | 40 | 50 |
| Site Reliability Engineer | 18 | 21.5 | 25 |
| Cloud Architect | 30 | 45 | 60 |
| Enterprise Architect | 35 | 47.5 | 60 |
| Cloud Engineer | 20 | 27.5 | 35 |
| Cloud Manager | 35 | 45 | 55 |
Testing
| Role | From | Avg | To |
|---|---|---|---|
| Test Manager | 35 | 42.5 | 50 |
| Test Lead | 25 | 30 | 35 |
| QA/Test Analyst | 15 | 20 | 25 |
Cybersecurity / Information Security
| Role | From | Avg | To |
|---|---|---|---|
| Cybersecurity Architect | 35 | 47.5 | 60 |
| IT Security Manager | 35 | 45 | 55 |
| IT Security Engineer | 20 | 30 | 40 |
| Security Analyst | 15 | 20 | 25 |
| SOC Manager | 15 | 22.5 | 30 |
| SOC Engineer | 8 | 11.5 | 15 |
| Penetration Tester | 20 | 30 | 40 |
| Application Security Specialist | 25 | 30 | 35 |
| Security Consultant | 20 | 27.5 | 35 |
| Information Security Manager | 25 | 35 | 45 |
| Information Security Engineer | 12 | 16 | 20 |
| Governance, Risk & Compliance (GRC) Manager | 25 | 30 | 35 |
Energy
The Middle East energy sector is undergoing a massive transition. While oil and gas remain vital, heavy investment in clean energy (solar, wind, hydrogen) is creating a growing need for workers who understand both traditional and renewable technologies.
Management Consulting and Strategy Consulting
| Role | From | Avg | To |
|---|---|---|---|
| CEO | 60 | 90 | 110 |
| COO | 55 | 70 | 90 |
| Business Development Manager | 30 | 35 | 40 |
| Commercial Manager | 30 | 45 | 60 |
| Contracts & Procurement Specialist | 22 | 30 | 45 |
| Investment Analyst | 18 | 25 | 35 |
| Sustainability Manager | 32 | 35 | 50 |
| Carbon Capture & Storage (CCS) Specialist | 30 | 40 | 50 |
| Project Manager | 35 | 55 | 65 |
| Construction Manager | 35 | 45 | 70 |
| Operations Manager | 35 | 45 | 55 |
| Engineering Manager | 30 | 45 | 60 |
| Asset Manager | 30 | 42 | 55 |
| Offshore Installation Manager | 38 | 55 | 70 |
Engineering Roles
| Role | From | Avg | To |
|---|---|---|---|
| Senior Process Engineer | 28 | 35 | 45 |
| Senior Drilling Engineer | 35 | 42 | 55 |
| Senior Maintenance Engineer | 25 | 32 | 40 |
| Renewable Energy Engineer | 20 | 27 | 35 |
| Civil Engineer | 18 | 25 | 30 |
| Pipeline Engineer | 20 | 27 | 35 |
| Electrical Engineer | 18 | 25 | 32 |
| Mechanical Engineer | 18 | 25 | 32 |
| ROV Technician | 15 | 22 | 30 |
| HSE Engineer | 18 | 25 | 32 |
| Reliability Engineer | 20 | 27 | 35 |
Renewables Engineering
| Role | From | Avg | To |
|---|---|---|---|
| Commissioning Engineer | 15 | 20 | 28 |
| Project Engineer | 18 | 24 | 30 |
| Production Engineer | 20 | 26 | 32 |
| Solar Design Engineer | 18 | 25 | 32 |
| Wind Resource Analyst | 18 | 25 | 32 |
| Grid Integration Engineer | 20 | 28 | 35 |
| EV Charging Infrastructure Engineer | 20 | 27 | 35 |
| Wind Farm Site manager | 25 | 32 | 40 |
| Power Purchase Agreement Manager | 25 | 35 | 45 |
| Green Finance Manager | 28 | 40 | 55 |
Energy Transition
| Role | From | Avg | To |
|---|---|---|---|
| Smart Grid Specialist | 25 | 35 | 45 |
| Energy Transition Consultant | 28 | 40 | 55 |
| VP of Energy Transition | 55 | 70 | 95 |
| Hydrogen & New Energies Specialist | 30 | 45 | 60 |

Frequently Asked Questions (FAQ)
Q: What is the overall job market outlook for the UAE in 2026?
A: The outlook is very positive. The economy is projected to grow by 4.5%, driven by non-oil sectors. This is creating a competitive, candidate-driven market where skilled professionals have a strong advantage.
Q: Which industries are hiring the most in Dubai and Abu Dhabi?
A: Technology (specifically AI and Data Analytics), Banking and Financial Services (Wealth Management, Private Equity), and Consultancy (Strategy, Digital Transformation) are the most active sectors. Property, Construction, and Energy also show robust demand.
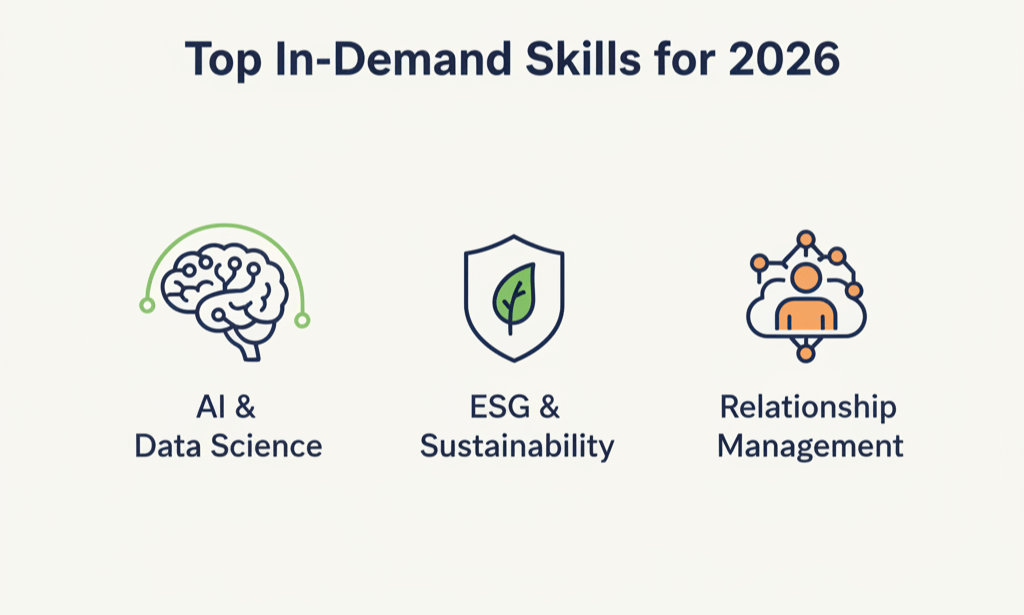
Q: What are the most in-demand skills for 2026?
A: Digital and tech skills are critical across all sectors. Key areas include AI Engineering, MLOps, Data Science, Digital Strategy, ESG Advisory, and Relationship Management. Professionals combining technical knowledge with commercial awareness are highly valued.
Q: Are salaries expected to increase in the UAE?
A: While overall salary growth is moderate, professionals in high-demand roles and sectors are seeing significant increases. The guide shows that specialists, such as mid-level legal counsels or AI engineers, can command premium salaries due to talent shortages.
Q: What do I need to know about working in the UAE?
A: The UAE is a global hub that attracts talent from around the world. Understanding the work culture and visa requirements is important. For instance, the UAE Green Visa offers new long-term residency options for skilled professionals. Before you start applying, make sure your approach is effective with your ultimate guide to a job search in Dubai.
Further Reading
- Michael Page UAE Salary Guide 2026: Access the full, detailed report directly from the source.


Leave a comment